Use the Margin of Error for One Sample Mean Explorer to determine a sample size for a confidence, prediction, or tolerance interval for one sample mean. Select DOE > Sample Size Explorers > Confidence Intervals > Margin of Error for One Sample Mean . Explore the trade offs between variability assumptions, sample size, significance, and the margin of error.
Set study assumptions and explore sample sizes using the radio buttons, text boxes, and menus. The profiler updates as you make changes to the settings. Alternatively, change settings by dragging the cross hairs on the profiler curves.
Specifies a one-sided interval (upper or lower bound)
Specifies a two-sided interval.
Specifies a confidence interval for a mean.
Specifies a prediction interval for one future observation.
Specifies a tolerance interval to cover a proportion of the population.
Specifies the confidence level is 1 - alpha. The default alpha level is 0.05 for a 95% confidence interval.
(Available only when Tolerance is selected for Interval Purpose.) Specifies the proportion of the population for the tolerance interval to cover.
Population Standard Deviation
Specifies the distribution for calculations.
Specifies a known standard deviation, calculations use the z distribution.
Specifies an unknown standard deviation, calculations use the t distribution.
The profiler enables you to visualize the impact of sample size assumptions on the margin of error calculations.
Enables you to solve for the sample size or assumed standard deviation.
Margin of Error
Specifies the half-width of the interval. With all other parameters fixed, margin of error decreases as sample size increases.
Specifies the total number of observations (runs, experimental units, or samples) needed to construct your interval.
Specifies the assumed population standard deviation.
The Explorer red triangle menu and report buttons provide additional options:
Opens a data table of simulated data based on the explorer settings. View the simulated response column formula for the settings used.
Make Data Collection Table
Creates a new data table that you can use for data collection. The table includes scripts to facilitate data analysis.
Saves the current settings to the Saved Settings table. This enables you to save a set of alternative study plans. See Saved Settings in the Sample Size Explorers.
Reset to Defaults
Resets all parameters and graphs to their default settings.
Opens JMP online help.
The calculation for each interval type uses the standard normal-based procedures if σ is known and t distribution procedures or approximations otherwise.
The margin of error (MOE) for a two-sided confidence intervals is calculated as follows:
The MOE for a one-sided confidence interval is calculated as follows:
α is the significance level
z 1- α is the (1 - α ) th quantile of the normal distribution
t 1- α ,ν is the (1 - α ) th quantile of the central t -distribution with ν degrees of freedom
σ is the assumed population standard deviation
n is the number of samples.
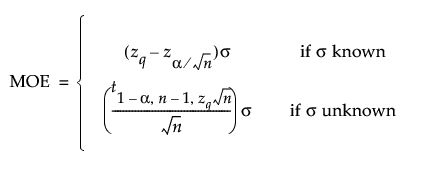
The margin of error (MOE) for prediction intervals is calculated as follows:
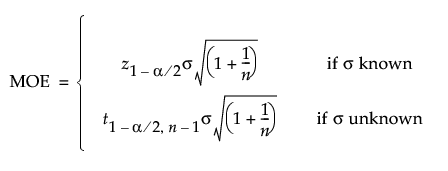
The bound is calculated as follows:
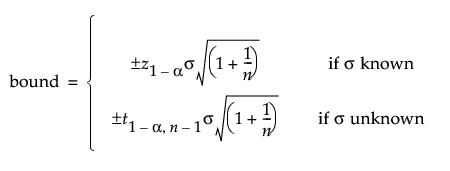
α is the significance level
z 1- α is the (1 - α ) th quantile of the normal distribution
t 1- α ,ν is the (1 - α ) th quantile of the central t -distribution with ν degrees of freedom
σ is the assumed population standard deviation
n is the number of samples.
When the population standard deviation is known, the margin of error is computed based on approximate procedures described in Krishnamoorthy and Mathew ( 2009 ). When the population standard deviation is unknown, the two-sided interval uses a correction to Howe’s approximation.
For a two-sided tolerance interval to cover proportion q of the population the margin of error (MOE) for tolerance intervals is calculated as follows:
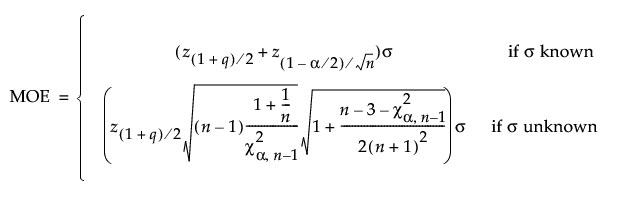
For a one-sided tolerance interval to cover proportion q of the population the margin of error (MOE) for tolerance intervals is calculated as follows:
α is the significance level
z α is the α th quantile of the normal distribution
χ 2 α ,ν is the α th quantile of a central χ 2 distribution with ν degrees of freedom
t 1- α ,ν is the (1 - α ) th quantile of the central t -distribution with ν degrees of freedom
σ is the assumed population standard deviation
n is the number of samples.